Bayesian Deconvolution
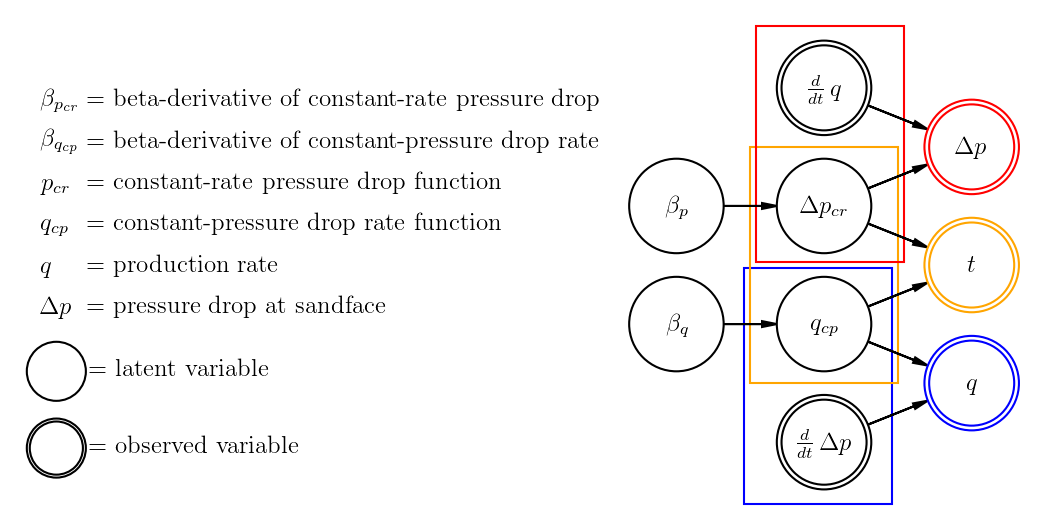
This is Fulford’s model for simultaneous inversion of the constant-rate pressure function and constant-pressure rate function for variable-rate variable-pressure fluid flow through porous media.
import daft

scale = 1.6
pgm = daft.PGM()

# Add Nodes
pgm.add_node("beta dP", r"$\beta_{p}$", 1, 1, scale)
pgm.add_node("pwf_cr", r"$\Delta p_{cr}$", 2.25, 1, scale)

pgm.add_node("beta qD", r"$\beta_{q}$", 1, 0, scale)
pgm.add_node("q_cp", r"$q_{cp}$", 2.25, 0.0, scale)

pgm.add_node("pwf_prime_obs", r"$\frac{d}{dt}\,\Delta p$", 2.25, -1, scale, alternate=True)
pgm.add_node("q_prime_obs", r"$\frac{d}{dt}\,q$", 2.25, 2, scale, alternate=True)

pgm.add_node("pwf_conv", r"$\Delta p$", 3.5, 1.5, scale, alternate=True, plot_params={"ec": "red"})

pgm.add_node("q_conv", r"$q$", 3.5, -0.5, scale, alternate=True, plot_params={"ec": "blue"})

pgm.add_node("t_conv", r"$t$", 3.5, 0.5, scale, alternate=True, plot_params={"ec": "orange"})


# Add Plates
pgm.add_plate([1.625 - 0.05, -1.5 - 0.025, 1.25, 2], rect_params={"ec": "blue"})
pgm.add_plate([1.625, -0.5, 1.25, 2], rect_params={"ec": "orange"})
pgm.add_plate([1.625 + 0.05, 0.5 + 0.025, 1.25, 2], rect_params={"ec": "red"})


# Add Connections
pgm.add_edge("beta dP", "pwf_cr")

pgm.add_edge("beta qD", "q_cp")

pgm.add_edge("pwf_prime_obs", "q_conv")
pgm.add_edge("q_prime_obs", "pwf_conv")
pgm.add_edge("pwf_cr", "pwf_conv")
pgm.add_edge("q_cp", "q_conv")

pgm.add_edge("pwf_cr", "t_conv")
pgm.add_edge("q_cp", "t_conv")

# Legend
x0 = -3.75
pgm.add_node("latent", "", x0 - 0.5, -0.4, 1)
pgm.add_text(x0 - 0.225, -0.4 - 0.08, "= latent variable")
pgm.add_node("observed", "", x0 - 0.5, -1.05, 1, alternate=True)
pgm.add_text(x0 - 0.225, -1.05 - 0.08, "= observed variable")

x0 -= 0.24
dx = -0.4
y0 = 1.8
dy = -0.35
pgm.add_text(x0 + dx, y0 + 0 * dy, r"$\beta_{p_{cr}}$")
pgm.add_text(x0, y0 + 0 * dy, "= beta-derivative of constant-rate pressure drop")
pgm.add_text(x0 + dx, y0 + 1 * dy, r"$\beta_{q_{cp}}$")
pgm.add_text(x0, y0 + 1 * dy, "= beta-derivative of constant-pressure drop rate")
pgm.add_text(x0 + dx, y0 + 2 * dy, r"$p_{cr}$")
pgm.add_text(x0, y0 + 2 * dy, "= constant-rate pressure drop function")
pgm.add_text(x0 + dx, y0 + 3 * dy, r"$q_{cp}$")
pgm.add_text(x0, y0 + 3 * dy, "= constant-pressure drop rate function")
pgm.add_text(x0 + dx, y0 + 4 * dy, r"$q$")
pgm.add_text(x0, y0 + 4 * dy, "= production rate")
pgm.add_text(x0 + dx, y0 + 5 * dy, r"$\Delta p$")
pgm.add_text(x0, y0 + 5 * dy, "= pressure drop at sandface")

# Render and save.
pgm.render()
<matplotlib.axes._axes.Axes at 0x7f120d5a18d0>